PHX-UGM Scenario Descriptions
SCENARIO 1: MANAGED represents a more managed approach to growth. The density rate is increased by 10% over 10 years (starting in 2002) to represent infill and the decrease in proportion of single-family dwellings and the growth rate is decreased by 5% over 10 years (starting in 2002) to represent the decreased desirability of the area. Parks are created according to the method described under Parks and State Trust Lands and only 50% of state trust lands are opened to development in 2007 to fulfill the desire of the residents to protect open spaces.SCENARIO 2: STATUS QUO represents the continuation of development status quo. Developers continue to provide large, single-family dwellings as the market demands. The density and growth rates remain at the 1995 rates. Parks are created according to the method described under Parks and State Trust Lands and all state trust lands are sold to developers and opened to development in 2007. SCENARIO 3: ULTRA-MANAGED represents a hard-line approach to growth management, similar to that proposed in 1997 by the Sierra Club and others in one of the local growth initiative propositions. The density rate is increased by 25% over 10 years (starting in 2002) to represent infill and the decrease in proportion of single-family dwellings and the growth rate is decreased by 15% over 10 years (starting in 2002) to represent the decreased desirability of the area. Parks are created from 50% of the state trust lands according to the method described under Parks and State Trust Lands and the rest opened to development in 2007. |
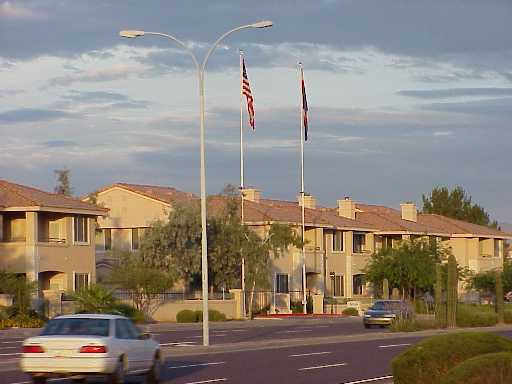
Higher density housing, such as these luxury apartments, helps control urban growth, but is less popular with those who want the American dream - a home of their own