A
Hierarchical Patch Dynamics Approach to Regional Modeling and Scaling
This has been supported by U.S. EPA (Science To Achieve Results, STAR
Program, R827676-01-0)
and US NSF (Central Arizona-Phoenix LTER)
OBJECTIVES OF THE RESEARCH
PROJECT:
The major research goals of this research project were
two-fold: (1) To develop and test a hierarchical patch dynamics
modeling and scaling approach to regional analysis and assessment, and
(2) To develop an understanding of how the Phoenix landscape has
changed over the past several decades as a consequence of urbanization
and how land use and land cover change affects ecosystem processes at
the regional scale. To achieve these goals, several specific
questions were addressed through field work, simulation modeling and
statistical analysis. Efforts were made to develop simulation
models to project land use and land cover change (LUCC) and to relate
ecosystem processes to LUCC from the local to the regional scale in the
Phoenix metropolitan area.
SUMMARY/ACCOMPLISHMENTS:
This project has generated a number of products, including 6
books and special journal issues, more than 40 journal papers and book
chapters, more than 30 conference presentations and invited talks, and
6 Masters theses and doctoral dissertations. In the following, we
summarize the research achievements of this project in several
sections: (1) the development of the hierarchical patch dynamics
scaling and modeling framework, (2) field work and database
development, (3) scaling relations of landscape patterns, (4)
spatiotemporal patterns of urbanization in the Phoenix metropolitan
region and ecological effects, and (5) publications and
presentations.
1. The Development Of The
Hierarchical Patch Dynamics Scaling And Modeling Framework
One of the main goals of this project was to develop a conceptual
framework for scaling and modeling across heterogeneous
landscapes. Spatial patchiness is ubiquitous in ecological
systems. The theory of patch dynamics, assuming that ecological
systems are dynamic patch mosaics, studies the structure, function and
dynamics of patchy systems with an emphasis on their emergent
properties that arise from interactions at the patch level. On
the one hand, hierarchy theory provides useful guidelines for
“decomposing” complex systems and focuses on a “vertical”
perspective. On the other hand, patch dynamics deals explicitly
with the spatial heterogeneity and its change, an apparent "horizontal"
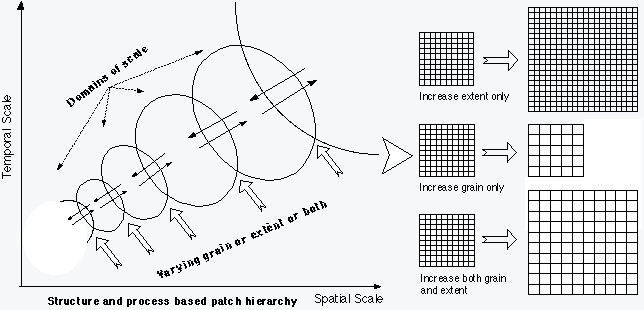
or landscape perspective (Wu, 1999, 2000). The hierarchical patch
dynamics (HPD) paradigm integrates hierarchy theory and patch dynamics,
and emphasizes the dynamic relationship among pattern, process, and
scale in a landscape context (Fig. 1). As a result of the
integration of the two perspectives, HPD unites structural and
functional components of a spatially extended system, like a landscape,
into a coherent hierarchical framework, which facilitates information
transfer and assessment across scales. The hierarchical patch
dynamics scaling and modeling framework – known as the “scaling ladder
approach” – was developed and reported in a series of publications (Wu
1999, Reynolds and Wu 1999, Wu 2000, Wu and David 2002).
2. Scaling Relations Of
Landscape Patterns
While recent studies have shed new light on the problems of
scale effects in landscape analyses, most existing studies using
landscape metrics considered only a few indices with a narrow range of
scales, and few have gone beyond merely reporting the existence of
scale effects to explore their generalities across different
landscapes. Thus, although ecologists are well aware that
changing scale often affects landscape metrics, scaling relations are
yet to be developed. Thus, we used data of real and simulated
landscapes to address several questions concerning scale effects and
scaling: (i) How do changing grain size and changing extent affect
different landscape metrics for a given landscape? (ii) How does
the behavior of various landscape metrics differ among distinctive
landscapes? (iii) Are there general scaling relations for certain
landscape metrics that are consistent across landscapes?
Our results showed that changing grain size and extent had significant
effects on both the class- and landscape-level metrics. Although
the landscapes under study were quite different in both the composition
and configuration of patches, the effects of changing scale fell into
two categories (simple scaling functions and unpredictable) for the
class-level metrics, and three categories for the landscape-level
metrics (simple scaling functions, staircase-like scaling behavior, and
unpredictable). Overall, more metrics showed consistent scaling
relations with changing grain size than with changing extent at both
the class and landscape levels – indicating that effects of changing
spatial resolution are generally more predictable than those of
changing map sizes. While the same metrics tended to behave
similarly at the class level and the landscape level, the scale
responses at the class level were much more variable. These
results appear robust not only across different landscapes, but also
independent of specific map classification schemes.
In addition, our results provide practical guidelines for scaling of
spatial pattern. For example, landscape metrics with simple
scaling relations reflect those landscape features that can be
extrapolated or interpolated across spatial scales readily and
accurately using only a few data points. In contrast,
unpredictable metrics represent landscape features whose extrapolation
is difficult, which requires information on the specifics of the
landscape of concern at many different scales. Finally, to
quantify spatial heterogeneity using landscape metrics, it is both
necessary and desirable to use landscape metric scalograms, in stead of
single-scale values. Indeed, a comprehensive empirical database
containing pattern metric scalograms and other forms of multiple-scale
information of diverse landscapes is crucial for achieving a general
understanding of landscape patterns and developing spatial scaling
rules.
3. Urbanization and Its
Ecological Effects
In the southwest U.S., the Phoenix metropolitan area in particular,
urbanization has profoundly changed the desert landscape. In
fact, Phoenix has become the sixth largest city with the highest
population growth rate in the United States. To understand the
interactions between urbanization and ecological conditions, we have
been developing models based on the hierarchical patch dynamics
paradigm to simulate the pattern and process of urban growth and its
ecological consequences. Here we highlight several of our studies
that were aimed to understand the spatial and temporal patterns of
urbanization and their effects on ecosystem dynamics, using spatial
analyses and models based on the hierarchical patch dynamics scaling
and modeling framework.
Gradient Analysis of Urbanization
Pattern. Quantifying landscape pattern and its change is
essential for the monitoring and assessment of ecological consequences
of urbanization. Combining gradient analysis with landscape
metrics, we studied the spatial pattern of urbanization in the Phoenix
metropolitan area, Arizona, USA to understand the landscape structure
and ecological consequences. Our study has demonstrated that the
center and spatial pattern of urbanization can be quantified using a
combination of landscape metrics and gradient analysis. Different
land use types exhibited distinctive, but not necessarily unique,
spatial signatures that were dependent on specific landscape
metrics. For example, for patch type percent coverage, patch
density, patch size coefficient of variation, landscape shape index,
and area-weighted mean patch shape index, residential and urban land
use types displayed similar patterns along the transect from west to
the urban center – a largely monotonic gradient with its peak at the
urban core. Desert showed a similar pattern for patch density,
patch size coefficient of variation, landscape shape index, and
area-weighted mean patch shape index, but a rather different pattern
for patch type percent coverage and mean patch size. For all the
six measures, agriculture displayed a very different, yet unique,
multiple-peaked pattern. Therefore, different land use types may
indeed show distinctive “spatial signatures” as distance-based
“landscape pattern profiles” which may be used to compare urban
developmental patterns between cities and dynamics of the same city
over time. Such comparisons may help understand different
underlying processes that are responsible for various forms of urban
morphology.
It was clear, though not surprising, from this study that the degree of
human impact on the Phoenix landscape depended on the distance from the
urban center. An urbanization center was clearly identifiable
with the six landscape metrics when plotted along a transect.
Specifically, all the landscape metrics indicated dramatic changes in
landscape pattern at 75 km and 155 km, marking the urbanizing front of
the Phoenix metropolitan area in the west-east direction. While
the landscape-level metrics were able to characterize the center of
urbanization as having the smallest mean patch size and the highest
patch richness, patch density, patch size coefficient of variation,
landscape shape index, and area-weighted mean shape index, the
class-level indices provided more detailed information on the relative
contributions of individual land use types. The high degrees of
fragmentation and spatial complexity of the urbanization center, while
not new findings of the sort, were able to be quantified in relation to
distance and individual land use types. Processes and factors
responsible for urbanization such as socioeconomic activities and land
ownership resulted in the heterogeneous arrangement of land uses in the
Phoenix metropolitan area.
Urban Growth Modeling.
We developed computer models to simulate the land use and land cover
change in the Phoenix metropolitan region. These models were used
to examine a series of model calibration and evaluation methods, and to
carry out scenario-based simulation analyses of the future development
patterns of the region. The results showed that at finer levels the
noise and uncertainty in input data and the exponentially increased
computational requirements would considerably reduce the usefulness and
accuracy of such models. At the other extreme, model projections
with too coarse a spatial resolution would be of little use at the
local and regional scales. A series of scenario analyses
suggested that the Metropolitan Phoenix area would soon be densely
populated demographically and highly fragmented ecologically unless
dramatic actions are to be taken soon to significantly slow down the
population growth. Also, there would be an urban morphological
threshold over which drastic changes in certain aspects of landscape
pattern occur. Specifically, the scenarios indicated that, as
large patches of open lands (including protected lands, parks and
available desert lands) would begin to break up, patch diversity would
decline due partly to the loss of agricultural lands, and the overall
landscape shape complexity would also decreases because of the
predominance of urban lands. It seemed that reaching such a
threshold could be delayed, but not avoided, if the population in the
Phoenix metropolitan region continues to grow.
Effects Of Urbanization On
Ecosystem Processes. We investigated the effects of
urbanization on the ecosystem processes in the Phoenix metropolitan
region through ecosystem modeling. Based on the ecosystem model,
PALS (Patch AridLand Simulator) originally developed for the Chihuahuan
Desert in the Jornada basin by James F. Reynolds and his associates
(Reynolds et al. 1993, 1997, Reynolds and Wu 1999), we developed
PALS-PHX which is suited for the Sonoran Desert in the Phoenix region
(Shen, Wu, et al. to be submitted). Model parameterization and
simulation experiments were based on data from the Central Arizona
–Phoenix Long-Term Ecological Research (CAP-LTER) project and our own
field work supported by the EPA STAR program.
Model predictions were validated using field observations. The
results showed that PALS-FT was able to simulate ANPP of this typical
Sonoran Desert ecosystem reasonably well, with a relative error of
–2.4% at the ecosystem level and generally <25% at the
functional-type level. We then used the model to simulate ANPP
and its seasonal and inter-annual dynamics for a similar ecosystem
within the CAP LTER study area. The model predicted an average
annual ANPP of 72.3 g m-2 y-1, ranging from 11.3 g m-2 y-1 to 229.6 g
m-2 y-1 in a 15-year simulation. The simulated average ANPP of
the Sonoran Desert ecosystem was close to field observations, and the
range of variation also was close to that reported by other researchers
for arid and semiarid ecosystems. The dynamics of ecosystem ANPP
in response to fluctuations in annual precipitation simulated by the
model agreed well with the known relationship between ANPP and
precipitation in arid and semiarid systems. A closer examination
of this relationship at the level of plant functional types further
revealed that seasonal distribution of rainfall significantly affected
ANPP. In addition, we are continuing our efforts to investigate
how urbanizatioin-induced environmental changes (increases in CO2,
temperature, and N deposition) affect ecosystem processes.
PUBLICATIONS
Books: